29. Text: Show Me
Text Walkthrough of Previous Video
Show Me
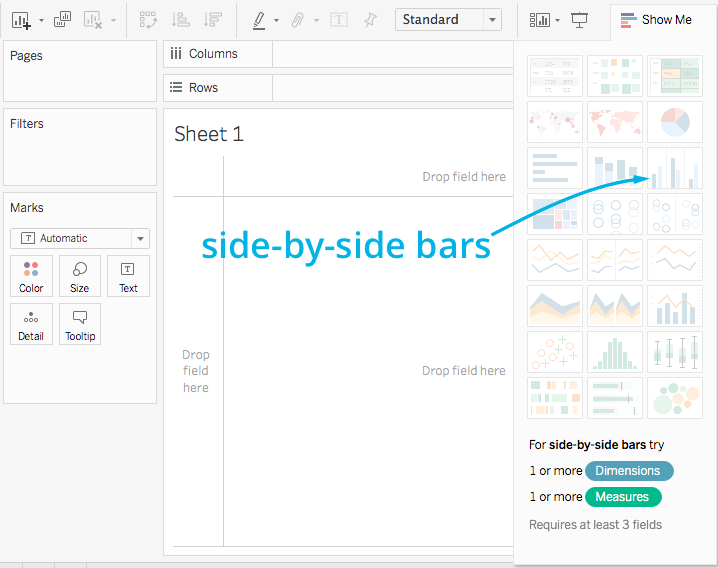
The Show Me feature is a quick way to start with a basic graph which you can add to afterwards. You can find it in the top-right of the sheet. You can see it in action below.

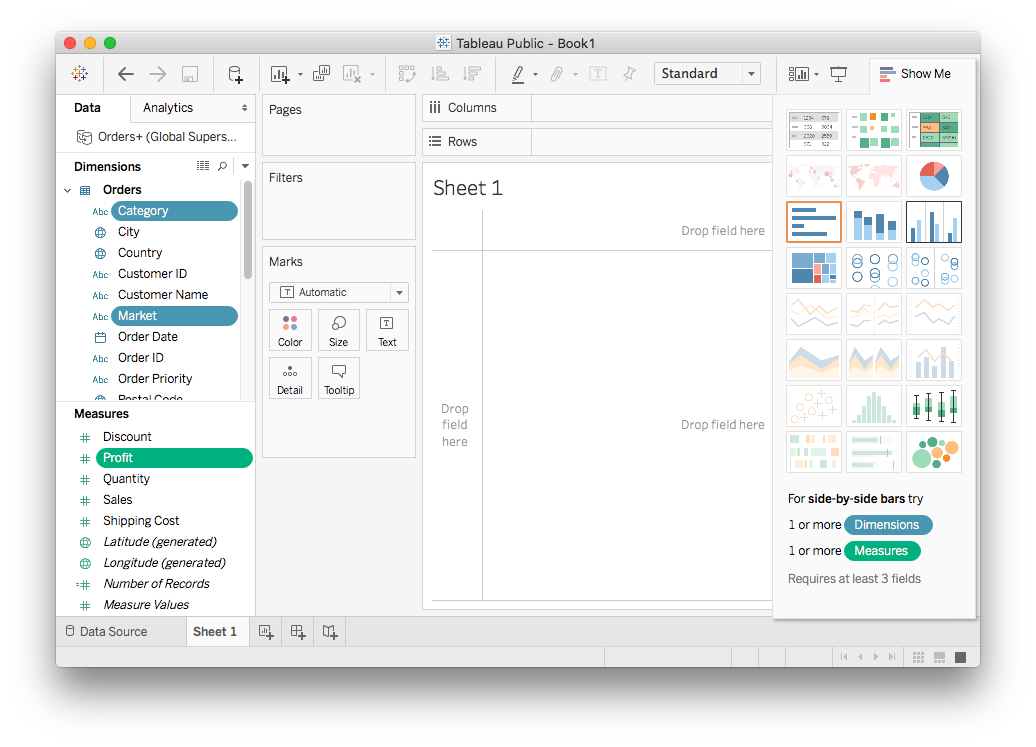
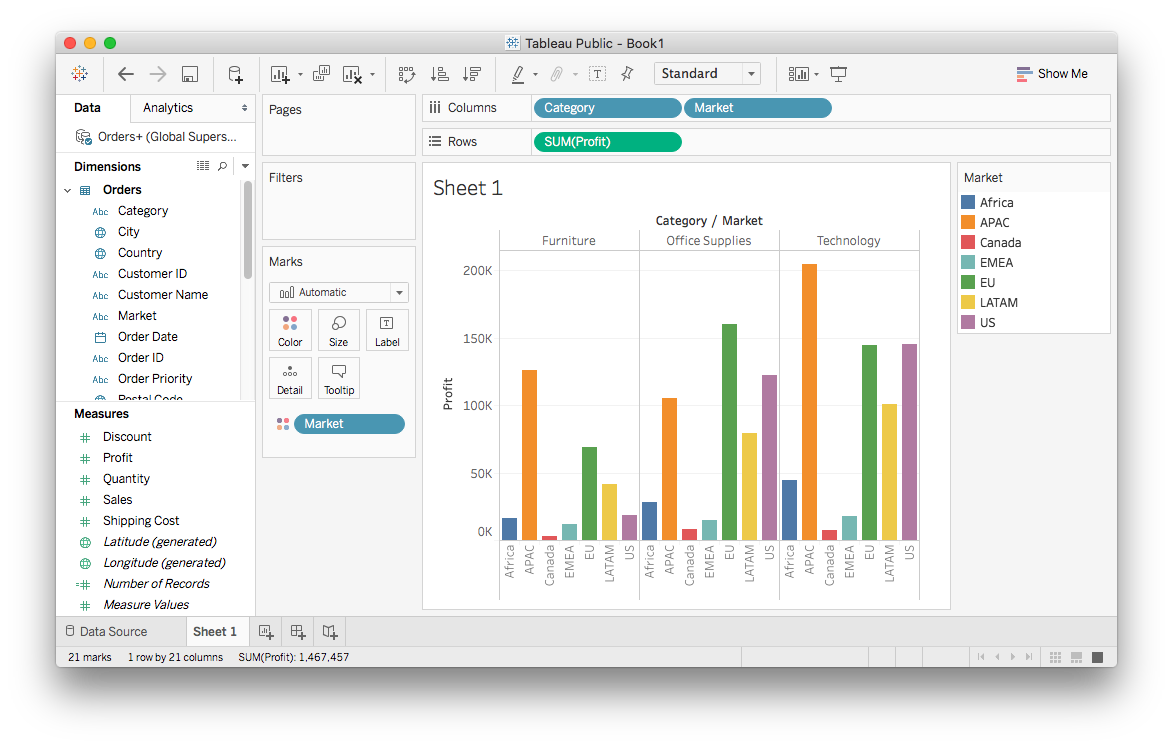
You can see that side-by-side bars wants one or more dimensions and one or more measures. Try selecting Market, Category, and Profit. You can hold command control (depending on your operating system) and click on multiple fields to select them. With those selected, select side-by-side bars and it’ll make the graph for you.


From there you can customize the graph. Show Me is usually a good start once you decide what you want to look at or show. Feel free to take some time to play around with the Show Me panel, there are a lot of different plots you can make.